3.3 AWS 网络与监控:VPC/CloudWatch 闭环
3.3 AWS 网络与监控:VPC/CloudWatch 闭环
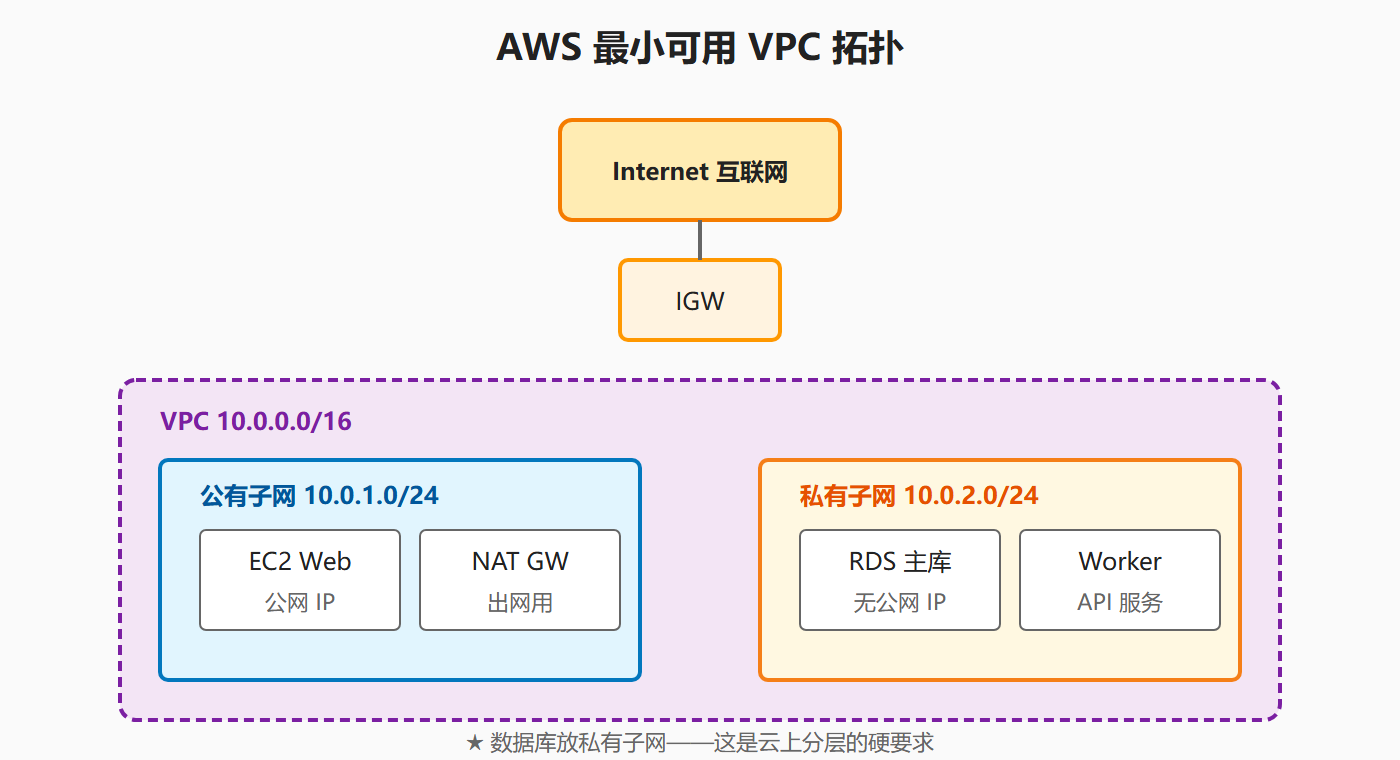
本节摘要:把第三章前两节的"计算 + 存储"用网络连起来,再加上监控形成闭环,本节就是这个工程动作的实战。我们建一个最小可用 VPC(1 个公有子网 + 1 个私有子网 + 1 个 NAT 网关 + 1 个 Internet Gateway),把 EC2 放公有子网、RDS 放私有子网;然后用 CloudWatch 设指标告警、日志聚合、自动化处理,把"出问题能看见 + 出问题能响应"做成工程闭环。
学习目标
图:AWS VPC 最小拓扑
阅读完本节,你应当能够:
- 用 AWS CLI 创建一个最小可用 VPC:含公有子网、私有子网、IGW、NAT、路由表。
- 理解"公有子网 vs 私有子网"的本质差异:是否能直接出公网、是否能被公网直接访问。
- 配置 CloudWatch 指标告警:CPU > 80% 持续 5 分钟触发 SNS 通知。
- 用 CloudWatch Logs Insights 查日志:用类 SQL 语法聚合 EC2 / Lambda / RDS 的日志。
一、先看个反例:数据库放公有子网 = 把保险柜放门口
最常见的"假私有云"反例:某团队把所有 EC2 和 RDS 都放公有子网,理由是"内网 IP 不好配,要用公网 IP 才能连数据库"。结果是:数据库的 3306 端口在公网裸奔,3 个月内被扫描攻击 12 万次。
正解:RDS 永远放私有子网,EC2 分两种——Web 层(ALB/Nginx)放公有子网,API/Worker 层放私有子网。这是云上分层的硬要求,不是可选优化。
二、核心原理:最小可用 VPC 架构
2.1 VPC 拓扑
2.2 用 CLI 搭建这个 VPC
# 1. 创建 VPC VPC_ID=$(aws ec2 create-vpc --cidr-block 10.0.0.0/16 --query 'Vpc.VpcId' --output text) echo "VPC: $VPC_ID" # 2. 创建公有子网(10.0.1.0/24) PUB_SUB=$(aws ec2 create-subnet --vpc-id $VPC_ID --cidr-block 10.0.1.0/24 \ --availability-zone ap-east-1a --query 'Subnet.SubnetId' --output text) # 3. 创建私有子网(10.0.2.0/24) PRIV_SUB=$(aws ec2 create-subnet --vpc-id $VPC_ID --cidr-block 10.0.2.0/24 \ --availability-zone ap-east-1a --query 'Subnet.SubnetId' --output text) # 4. 创建并附加 Internet Gateway IGW_ID=$(aws ec2 create-internet-gateway --query 'InternetGateway.InternetGatewayId' --output text) aws ec2 attach-internet-gateway --vpc-id $VPC_ID --internet-gateway-id $IGW_ID # 5. 创建 NAT 网关(公有子网里) EIP_ALLOC=$(aws ec2 allocate-address --domain vpc --query 'AllocationId' --output text) NAT_ID=$(aws ec2 create-nat-gateway --subnet-id $PUB_SUB --allocation-id $EIP_ALLOC \ --query 'NatGateway.NatGatewayId' --output text) # 6. 配置路由表 PUB_RT=$(aws ec2 create-route-table --vpc-id $VPC_ID --query 'RouteTable.RouteTableId' --output text) aws ec2 create-route --route-table-id $PUB_RT --destination-cidr-block 0.0.0.0/0 --gateway-id $IGW_ID aws ec2 associate-route-table --subnet-id $PUB_SUB --route-table-id $PUB_RT PRIV_RT=$(aws ec2 create-route-table --vpc-id $VPC_ID --query 'RouteTable.RouteTableId' --output text) aws ec2 create-route --route-table-id $PRIV_RT --destination-cidr-block 0.0.0.0/0 --nat-gateway-id $NAT_ID aws ec2 associate-route-table --subnet-id $PRIV_SUB --route-table-id $PRIV_RT
这个最小 VPC 用了 5 个步骤,CLI 大约 15 行。控制台做同样的事要点 30 多次鼠标。
2.3 安全组(Security Group)配置
# Web 层安全组:允许 80/443 入站 WEB_SG=$(aws ec2 create-security-group --group-name web-sg --description "Web tier" \ --vpc-id $VPC_ID --query 'GroupId' --output text) aws ec2 authorize-security-group-ingress --group-id $WEB_SG --protocol tcp --port 80 --cidr 0.0.0.0/0 aws ec2 authorize-security-group-ingress --group-id $WEB_SG --protocol tcp --port 443 --cidr 0.0.0.0/0 # 数据库安全组:只允许 Web 层访问 3306 DB_SG=$(aws ec2 create-security-group --group-name db-sg --description "DB tier" \ --vpc-id $VPC_ID --query 'GroupId' --output text) aws ec2 authorize-security-group-ingress --group-id $DB_SG --protocol tcp --port 3306 \ --source-group $WEB_SG
关键差异:数据库安全组只允许来自 Web 安全组的流量(--source-group),不是 0.0.0.0/0。这是云上零信任的标准做法。
三、工程实践要点:CloudWatch 监控闭环
3.1 指标告警
# 创建 SNS 主题(接收告警) TOPIC_ARN=$(aws sns create-topic --name ops-alerts --query 'TopicArn' --output text) aws sns subscribe --topic-arn $TOPIC_ARN --protocol email --notification-endpoint ops@example.com # 创建告警:EC2 CPU > 80% 持续 5 分钟 aws cloudwatch put-metric-alarm \ --alarm-name ec2-high-cpu \ --alarm-description "EC2 CPU > 80% for 5 minutes" \ --metric-name CPUUtilization \ --namespace AWS/EC2 \ --statistic Average \ --period 300 \ --threshold 80 \ --comparison-operator GreaterThanThreshold \ --evaluation-periods 1 \ --alarm-actions $TOPIC_ARN \ --dimensions Name=InstanceId,Value=i-xxxxxxxx
3.2 日志聚合与查询
# 配置 EC2 把日志发到 CloudWatch Logs # (在 EC2 上装 CloudWatch Agent) # Logs Insights 查询:最近 1 小时的 5xx 错误 aws logs start-query \ --log-group-name /aws/ec2/myapp \ --start-time $(date -d '1 hour ago' +%s) \ --end-time $(date +%s) \ --query-string 'fields @timestamp, @message | filter @message like /ERROR/ | stats count() by bin(5m)' # 获取查询结果 aws logs get-query-results --query-id <query-id>
3.3 告警分级
| 级别 | 触发条件 | 通知方式 | 响应时间 |
|---|---|---|---|
| P0 | 服务完全不可用 | 电话 + 短信 + 钉钉/飞书 | 5 分钟 |
| P1 | 关键指标异常 | 短信 + 钉钉/飞书 | 30 分钟 |
| P2 | 性能降级 | 钉钉/飞书 | 4 小时 |
| P3 | 资源预警 | 邮件 | 1 个工作日 |
不要所有告警都发短信——告警疲劳是真实问题,工程师对短信麻木后,真出大事反而没人看。
3.4 反例:常见监控误区
| 反例 | 后果 | 正解 |
|---|---|---|
| 监控项过多(>100 个) | 告警疲劳 | 每个服务 5-10 个关键指标 |
| 没有日志归档 | 排错时无据可查 | 强制保留 90 天日志 + 归档到 S3 |
| 告警只发不处理 | 告警群变垃圾群 | 告警必须配 Runbook + 自动处理 |
| 只看应用层 | 数据库/网络层盲区 | OS + DB + 应用三层都要监控 |
| 没有合成监控 | 不知道外部用户体验 | 配 CloudWatch Synthetics 或外部监控 |
⚠️ 常见坑:"监控做完了" ≠ "运维闭环了"。监控只是"看",还要有"行动"——告警 + 通知 + 响应人 + Runbook + 复盘。只做监控不做响应 = 装了摄像头但没保安。
💡 关键直觉:CloudWatch 的核心价值是"指标 + 日志 + 告警"三件套 + 自动化响应。把"告警 → 通知 → 自动处理"做成闭环(Lambda 函数处理告警),才能从"人肉运维"过渡到"云上 SRE"。
本节小结
- VPC 拓扑最小可用配置:VPC + 公有子网 + 私有子网 + IGW + NAT + 路由表,5 步 15 行 CLI。
- 安全组分层:Web 安全组开 80/443,DB 安全组只允许来自 Web 安全组的 3306。
- CloudWatch 三件套:指标(Metrics)+ 日志(Logs)+ 告警(Alarms),缺一不可。
- 告警分级:P0/P1/P2/P3,不同级别配不同通知方式,避免告警疲劳。
- 监控 = 行动:只做监控不做响应 = 装了摄像头但没保安。
- CloudWatch Logs Insights 用类 SQL 语法查日志,是排错的瑞士军刀。
至此 AWS 深度上手结束。下一章切到阿里云——同样的链路,平行的命令。