可视化位置数据
文档摘要
可视化位置数据 本课概览的草图笔记 草图笔记由 Nitya Narasimhan 绘制。点击图片查看大图。 本视频将概述 Azure Maps 与 IoT 的服务,这是本课将要介绍的内容。 Azure Maps - 微软 Azure 企业定位平台 点击上面的图片观看视频 预习测验 预习测验 导论 在上一课中,您学习了如何通过无服务器代码将来自传感器的 GPS 数据保存到云中的存储容器。现在,您将了解如何在 Azure 地图上可视化这些点。您将学习如何在网页上创建地图、了解 GeoJSON 数据格式以及如何使用它在地图上绘制所有捕获的 GPS 点。
可视化位置数据

草图笔记由 Nitya Narasimhan 绘制。点击图片查看大图。
本视频将概述 Azure Maps 与 IoT 的服务,这是本课将要介绍的内容。
点击上面的图片观看视频
预习测验
导论
在上一课中,您学习了如何通过无服务器代码将来自传感器的 GPS 数据保存到云中的存储容器。现在,您将了解如何在 Azure 地图上可视化这些点。您将学习如何在网页上创建地图、了解 GeoJSON 数据格式以及如何使用它在地图上绘制所有捕获的 GPS 点。
本课我们将涵盖以下内容:
本课将涉及少量的 HTML 和 JavaScript。如果您想了解更多关于使用 HTML 和 JavaScript 进行网页开发的知识,请参阅 Web 开发入门。
什么是数据可视化
顾名思义,数据可视化是通过易于人类理解的方式来展示数据。通常与图表和图形相关联,但任何一种以图像形式表示数据的方式都可以帮助人们更好地理解数据,并帮助他们做出决策。
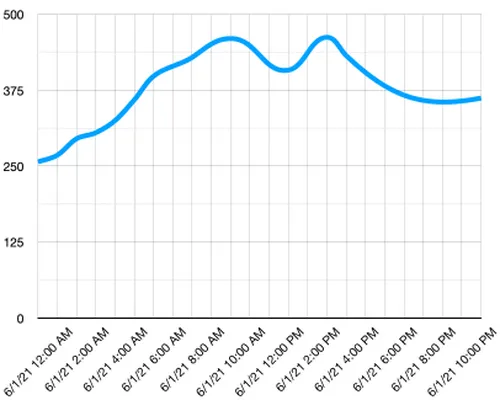
举一个简单的例子,在农场项目中,您捕获了土壤湿度设置。2021 年 6 月 1 日每小时捕获的土壤湿度数据可能如下所示:
| 日期 | 读数 |
|---|---|
| 2021-06-01 00:00 | 257 |
| 2021-06-01 01:00 | 268 |
| 2021-06-01 02:00 | 295 |
| 2021-06-01 03:00 | 305 |
| 2021-06-01 04:00 | 325 |
| 2021-06-01 05:00 | 359 |
| 2021-06-01 06:00 | 398 |
| 2021-06-01 07:00 | 410 |
| 2021-06-01 08:00 | 429 |
| 2021-06-01 09:00 | 451 |
| 2021-06-01 10:00 | 460 |
| 2021-06-01 11:00 | 452 |
| 2021-06-01 12:00 | 420 |
| 2021-06-01 13:00 | 408 |
| 2021-06-01 14:00 | 431 |
| 2021-06-01 15:00 | 462 |
| 2021-06-01 16:00 | 432 |
| 2021-06-01 17:00 | 402 |
| 2021-06-01 18:00 | 387 |
| 2021-06-01 19:00 | 360 |
| 2021-06-01 20:00 | 358 |
| 2021-06-01 21:00 | 354 |
| 2021-06-01 22:00 | 356 |
| 2021-06-01 23:00 | 362 |
作为人类,理解这些数据可能会很困难。这是一堵数字墙,没有任何意义。为了将这些数据可视化,可以将其绘制在一个折线图上:
通过添加一条线来指示当自动灌溉系统在土壤湿度读数为 450 时开启,可以进一步增强这个折线图:
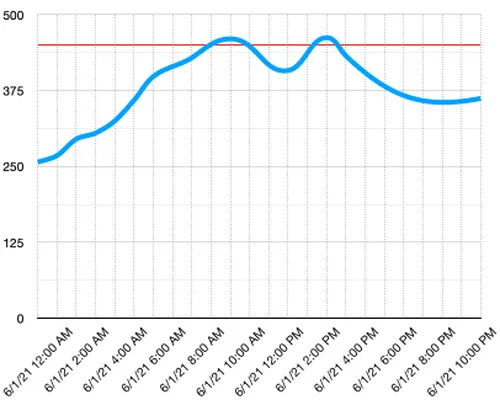
该图表快速显示了土壤湿度水平,以及灌溉系统开启的时间点。
图表并不是唯一的数据可视化工具。用于跟踪天气的物联网设备可以通过符号(如阴天用云符号,下雨天用雨云符号)在网页或移动应用中可视化天气条件。有许多方式可以可视化数据,有些严肃,有些有趣。
✅ 想一想你见过的数据可视化方法。哪种方法最清晰,让你最快地做出决策?
最好的可视化可以让人类快速做出决策。例如,显示工业机械各种读数的仪表墙很难处理,但当出现问题时亮起红灯则允许人类迅速做出决策。有时,最佳的可视化就是一个闪烁的灯光!
在处理 GPS 数据时,最清晰的可视化方法是在地图上绘制数据。例如,显示送货卡车的地图可以帮助加工厂的工人看到卡车何时到达。如果这张地图不仅显示了卡车当前位置的图片,还提供了卡车内货物的信息,那么加工厂的工人就可以相应地进行规划——如果他们看到附近有一辆冷藏车,他们就知道需要提前准备冰箱的空间。
地图服务
处理地图是一项有趣的练习,有许多选择,如 Bing Maps、Leaflet、Open Street Maps 和 Google Maps。在本课中,您将学习 Azure Maps 以及它们如何显示您的 GPS 数据。
Azure Maps 是“一组地理服务和 SDK,使用新鲜的映射数据为 Web 和移动应用程序提供地理上下文。”开发者可以获得工具,以创建美丽且交互式的地图,这些地图可以提供推荐的交通路线、交通事故信息、室内导航、搜索功能、高程信息、天气服务等。
✅ 实验一些 映射代码示例
您可以将地图显示为空白画布、瓦片、卫星图像、叠加道路的卫星图像、各种类型的灰度地图、带有阴影地形以显示高程的地图、夜视地图和高对比度地图。通过将其与 Azure 事件网格 集成,您可以实时更新地图。通过启用各种控件,可以控制地图的行为和外观,使其对捏合、拖动和点击等事件作出反应。要控制地图的外观,您可以添加包含气泡、线、多边形、热图等功能的图层。您实现的地图样式取决于您选择的 SDK。
您可以利用其 REST API、Web SDK 或者如果您正在构建移动应用,则可以利用其 Android SDK 来访问 Azure Maps API。
在本课中,您将使用 Web SDK 绘制地图并显示传感器的 GPS 位置路径。
创建 Azure Maps 资源
您的第一步是创建一个 Azure Maps 帐户。
任务 - 创建 Azure Maps 资源
-
从您的终端或命令提示符运行以下命令,在您的
gps-sensor资源组中创建一个 Azure Maps 资源:az maps account create --name gps-sensor \ --resource-group gps-sensor \ --accept-tos \ --sku S1这将创建一个名为
gps-sensor的 Azure Maps 资源。使用的级别是S1,这是一个付费级别,包括一系列功能,但免费提供大量的调用。要查看使用 Azure Maps 的成本,请查看 Azure Maps 定价页面。
-
您需要一个 API 密钥来访问地图资源。使用以下命令获取此密钥:
az maps account keys list --name gps-sensor \ --resource-group gps-sensor \ --output table复制
PrimaryKeyvalue.
Show a map on a web page
Now you can take the next step which is to display your map on a web page. We will use just one html 文件以供您的小型网络应用使用;请记住,在生产或团队环境中,您的网络应用可能有更多的组成部分!
任务 - 在网页上显示地图
-
在本地计算机上的某个文件夹中创建一个名为 index.html 的文件。添加 HTML 标记以容纳地图:
<html> <head> <style> #myMap { width:100%; height:100%; } </style> </head> <body onload="init()"> <div id="myMap"></div> </body> </html>地图将加载在
myMapdiv. A few styles allow it to span the width and height of the page.a
divis a section of a web page that can be named and styled. -
Under the opening
<head>标签中,添加外部样式表以控制地图显示,并添加来自 Web SDK 的外部脚本来管理其行为:<link rel="stylesheet" href="https://atlas.microsoft.com/sdk/javascript/mapcontrol/2/atlas.min.css" type="text/css" /> <script src="https://atlas.microsoft.com/sdk/javascript/mapcontrol/2/atlas.min.js"></script>此样式表包含地图外观的设置,脚本文件包含加载地图的代码。添加此代码类似于包含 C++ 头文件或将 Python 模块导入。
-
在该脚本下方,添加一个脚本块以启动地图。
<script type='text/javascript'> function init() { var map = new atlas.Map('myMap', { center: [-122.26473, 47.73444], zoom: 12, authOptions: { authType: "subscriptionKey", subscriptionKey: "<subscription_key>", } }); } </script>将
<subscription_key>with the API key for your Azure Maps account.If you open your
index.htmlpage in a web browser, you should see a map loaded, and focused on the Seattle area.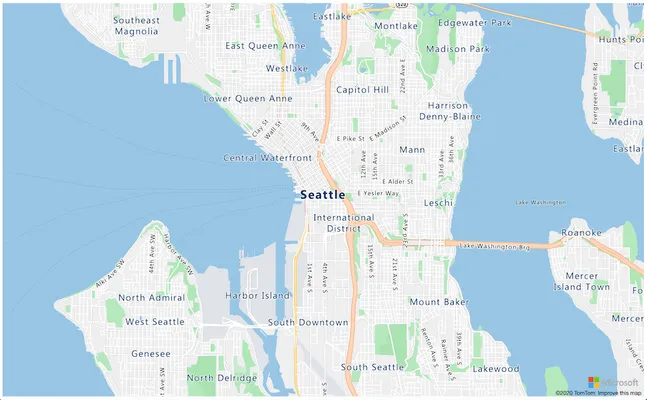
✅ Experiment with the zoom and center parameters to change your map display. You can add different coordinates corresponding to your data's latitude and longitude to re-center the map.
A better way to work with web apps locally is to install http-server. You will need node.js and npm installed before using this tool. Once those tools are installed, you can navigate to the location of your
index.htmlfile and typehttp-server。网络应用将在本地 Web 服务器上打开 http://127.0.0.1:8080/。
GeoJSON 格式
现在您已经设置好了包含地图的网络应用,下一步是从存储帐户中提取 GPS 数据并在地图顶部的标记层中显示它。在此之前,让我们先了解一下 Azure Maps 所需的 GeoJSON 格式。
GeoJSON 是一种特殊的 JSON 规范,专为处理地理特定数据而设计。您可以使用 geojson.io 测试示例数据来学习它,它也是一个有用的调试 GeoJSON 文件的工具。
示例 GeoJSON 数据看起来像这样:
{ "type": "FeatureCollection", "features": [ { "type": "Feature", "geometry": { "type": "Point", "coordinates": [ -2.10237979888916, 57.164918677004714 ] } } ] }
特别值得注意的是数据如何嵌套为 Feature within a FeatureCollection. Within that object can be found geometry with the coordinates indicating latitude and longitude.
✅ When building your geoJSON, pay attention to the order of latitude and longitude in the object, or your points will not appear where they should! GeoJSON expects data in the order lon,lat for points, not lat,lon.
Geometry 可以有不同的类型,如单个点或多边形。在这个示例中,它是一个具有两个坐标指定的点,即经度和纬度。
✅ Azure Maps 支持标准 GeoJSON 以及一些 增强功能,包括绘制圆和其他几何图形的能力。
使用 GeoJSON 在地图上绘制 GPS 数据
现在您准备好从上一课构建的存储中获取数据。作为提醒,它被存储为 Blob 存储中的多个文件,因此您需要检索这些文件并解析它们,以便 Azure Maps 可以使用这些数据。
任务 - 配置存储以从网页访问
如果您尝试从存储中调用数据以获取数据,您可能会惊讶地在浏览器的控制台中看到错误。这是因为您需要为 CORS 设置存储权限,以允许外部网页应用读取其数据。
CORS 代表“跨域资源共享”,出于安全原因通常需要在 Azure 中显式设置。它阻止您不期望的站点访问您的数据。
-
运行以下命令以启用 CORS:
az storage cors add --methods GET \ --origins "*" \ --services b \ --account-name <storage_name> \ --account-key <key1>将
<storage_name>with the name of your storage account. Replace<key1>with the account key for your storage account.This command allows any website (the wildcard
*means any) to make a GET request, that is get data, from your storage account. The--services bmeans only apply this setting for blobs.
Task - load the GPS data from storage
-
Replace the entire contents of the
init函数替换为以下代码:fetch("https://<storage_name>.blob.core.windows.net/gps-data/?restype=container&comp=list") .then(response => response.text()) .then(str => new window.DOMParser().parseFromString(str, "text/xml")) .then(xml => { let blobList = Array.from(xml.querySelectorAll("Url")); blobList.forEach(async blobUrl => { loadJSON(blobUrl.innerHTML) }); }) .then( response => { map = new atlas.Map('myMap', { center: [-122.26473, 47.73444], zoom: 14, authOptions: { authType: "subscriptionKey", subscriptionKey: "<subscription_key>", } }); map.events.add('ready', function () { var source = new atlas.source.DataSource(); map.sources.add(source); map.layers.add(new atlas.layer.BubbleLayer(source)); source.add(features); }) })将
<storage_name>with the name of your storage account. Replace<subscription_key>with the API key for your Azure Maps account.There are several things happening here. First, the code fetches your GPS data from your blob container using a URL endpoint built using your storage account name. This URL retrieves from
gps-data, indicating the resource type is a container (restype=container), and lists information about all the blobs. This list won't return the blobs themselves, but will return a URL for each blob that can be used to load the blob data.You can put this URL into your browser to see details of all the blobs in your container. Each item will have a
Urlproperty that you can also load in your browser to see the contents of the blob.This code then loads each blob, calling a
loadJSONfunction, which will be created next. It then creates the map control, and adds code to thereadyevent. This event is called when the map is displayed on the web page.The ready event creates an Azure Maps data source - a container that contains GeoJSON data that will be populated later. This data source is then used to create a bubble layer - that is a set of circles on the map centered over each point in the GeoJSON.
-
Add the
loadJSONfunction to your script block, below theinit函数替换为以下代码:var map, features; function loadJSON(file) { var xhr = new XMLHttpRequest(); features = []; xhr.onreadystatechange = function () { if (xhr.readyState === XMLHttpRequest.DONE) { if (xhr.status === 200) { gps = JSON.parse(xhr.responseText) features.push( new atlas.data.Feature(new atlas.data.Point([parseFloat(gps.gps.lon), parseFloat(gps.gps.lat)])) ) } } }; xhr.open("GET", file, true); xhr.send(); }此函数由 fetch 函数调用,用于解析 JSON 数据并将其转换为 GeoJSON 格式,以读取经度和纬度坐标。解析后,数据被设置为 GeoJSON
Feature的一部分。地图将被初始化,小气泡会出现在数据路径周围: -
在浏览器中加载 HTML 页面。它将加载地图,然后从存储中加载所有 GPS 数据并绘制在地图上。
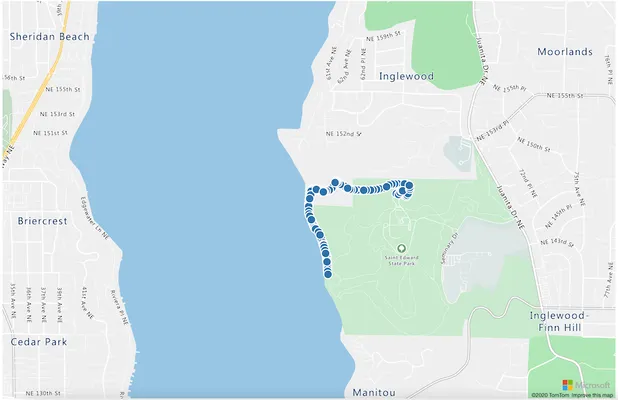
您可以在 code 文件夹中找到此代码。
挑战
能够静态地在地图上显示数据作为标记是很不错的。您能否增强此网络应用以添加动画效果,并显示标记随时间变化的路径?这里有一些使用地图内的动画的 示例。
课后测验
复习与自学
Azure Maps 对处理物联网设备特别有用。
- 研究一下 Microsoft 文档中的 Azure Maps 文档 中的一些用途。
- 通过 Microsoft Learn 上的使用 Azure Maps 创建第一个路线查找应用自学模块 深入了解地图制作和航点知识。
作业
声明:
本文件灏天文库团队进行了翻译。尽管我们力求准确,但请注意,翻译可能包含错误或不准确之处。原文档以其原始语言为准。我们不对因使用此翻译而产生的任何误解或误译负责。