7.处理数据:Python和Pandas库
文档摘要
处理数据:Python 和 Pandas 库 素描笔记由 (@sketchthedocs) 绘制 :-------------------------------------------------------------------------------------------------------: 使用 Python - 素描笔记由 @nitya 绘制 介绍视频 虽然数据库提供了非常高效的方式来存储数据并通过查询语言查询它们,但最灵活的数据处理方法是编写自己的程序来操纵数据。在许多情况下,执行数据库查询会更有效。然而,在需要复杂数据处理的情况下,使用 SQL 很难完成。 可以在任何编程语言中进行数据处理,但有些语言在处理数据方面更为高级。
处理数据:Python 和 Pandas 库
 |
|---|
| 使用 Python - 素描笔记由 @nitya 绘制 |
虽然数据库提供了非常高效的方式来存储数据并通过查询语言查询它们,但最灵活的数据处理方法是编写自己的程序来操纵数据。在许多情况下,执行数据库查询会更有效。然而,在需要复杂数据处理的情况下,使用 SQL 很难完成。
可以在任何编程语言中进行数据处理,但有些语言在处理数据方面更为高级。数据科学家通常首选以下语言之一:
- Python,一种通用编程语言,因其简单性而常被认为是初学者的最佳选择。Python 有许多额外的库可以帮助你解决许多实际问题,如从 ZIP 归档文件中提取数据或将图片转换为灰度图像。除了数据科学,Python 也经常用于 Web 开发。
- R 是一种传统工具箱,旨在进行统计数据分析。它包含大量库(CRAN),使其成为数据处理的好选择。然而,R 不是一种通用编程语言,很少在数据科学领域之外使用。
- Julia 是另一种专为数据科学开发的语言。它旨在提供比 Python 更好的性能,使其成为科学实验的强大工具。
在这节课中,我们将专注于使用 Python 进行简单的数据处理。我们假设你已经对这种语言有一定的了解。如果你想深入了解 Python,可以参考以下资源:
- 用 Turtle 图形和分形以有趣的方式学习 Python - GitHub 上的快速 Python 编程入门课程
- 使用 Microsoft Learn 开始使用 Python - Microsoft Learn 上的学习路径
数据可以有多种形式。在这节课中,我们将考虑三种形式的数据——表格数据、文本和图像。
我们将重点关注几个数据处理示例,而不是给你所有相关库的全面概述。这将帮助你理解可能的操作,并在需要时知道去哪里寻找解决方案。
最有用的建议。当你需要对数据执行某些操作但不知道如何操作时,请尝试在网上搜索。Stackoverflow 通常包含许多有用的 Python 示例代码,适用于许多典型任务。
课前测验
表格数据和数据框
当我们谈到关系型数据库时,你已经见过表格数据了。当你有大量的数据,并且这些数据包含在许多不同的关联表中时,使用 SQL 来处理它们显然是有意义的。然而,在很多情况下,我们有一个数据表,并且我们需要对该数据获得一些理解或洞察,例如分布、值之间的相关性等。在数据科学中,有很多情况需要对原始数据进行一些转换,然后进行可视化。这两个步骤都可以很容易地使用 Python 完成。
Python 中有两个最有用的库可以帮助你处理表格数据:
- Pandas 允许你操作所谓的数据框,这些数据框类似于关系表。你可以有命名列,并对行、列和数据框进行各种操作。
- Numpy 是一个用于处理张量(即多维数组)的库。数组具有相同的基本类型,比数据框更简单,但它提供了更多的数学运算,并产生更少的开销。
还有一些其他库你也应该了解:
- Matplotlib 是一个用于数据可视化和绘制图表的库
- SciPy 是一个带有额外科学功能的库。我们在讨论概率和统计时已经遇到过这个库。
以下是您通常会在 Python 程序开头导入这些库的代码:
import numpy as np import pandas as pd import matplotlib.pyplot as plt from scipy import ... # you need to specify exact sub-packages that you need
Pandas 的核心概念包括以下几个方面。
系列
系列是一组值,类似于列表或 Numpy 数组。主要区别在于系列还有一个索引,当我们对系列进行操作(例如相加)时,会考虑到索引。索引可以很简单,比如整数行号(这是默认情况下从列表或数组创建系列时使用的索引),也可以有复杂的结构,比如日期间隔。
注意:附带笔记本
notebook.ipynb中有一些介绍性的 Pandas 代码。我们只在这里概述了一些例子,你当然欢迎查看完整的笔记本。
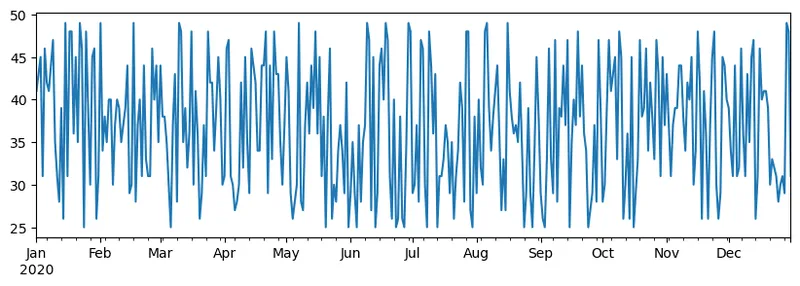
举个例子:我们想分析冰淇淋店的销售情况。让我们生成一段时间内每天销售数量(销售的物品数量)的系列:
start_date = "Jan 1, 2020" end_date = "Mar 31, 2020" idx = pd.date_range(start_date,end_date) print(f"Length of index is {len(idx)}") items_sold = pd.Series(np.random.randint(25,50,size=len(idx)),index=idx) items_sold.plot()
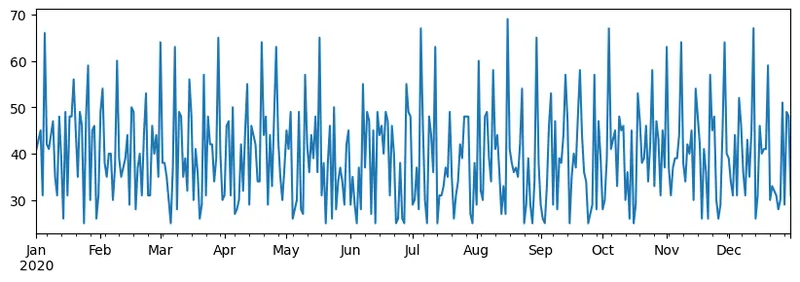
现在假设我们每周都会组织一个朋友聚会,并额外拿10包冰淇淋。我们可以创建另一个系列,用周作为索引,表示这一点:
additional_items = pd.Series(10,index=pd.date_range(start_date,end_date,freq="W"))
当我们把两个系列相加时,我们得到总数:
total_items = items_sold.add(additional_items,fill_value=0) total_items.plot()
注意,我们不是使用简单的语法
total_items+additional_items. If we did, we would have received a lot ofNaN(Not a Number) values in the resulting series. This is because there are missing values for some of the index point in theadditional_itemsseries, and addingNanto anything results inNaN. Thus we need to specifyfill_value参数来进行相加。
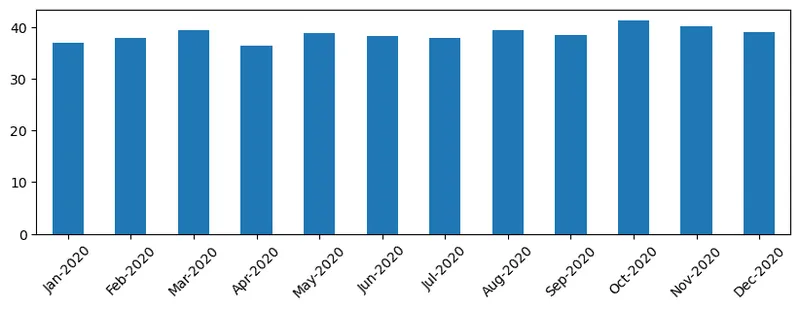
对于时间序列,我们还可以使用不同的时间间隔重采样。例如,如果我们想要计算每月的平均销售额,我们可以使用以下代码:
monthly = total_items.resample("1M").mean() ax = monthly.plot(kind='bar')
数据框
数据框本质上是一组具有相同索引的系列。我们可以将多个系列组合成一个数据框:
a = pd.Series(range(1,10)) b = pd.Series(["I","like","to","play","games","and","will","not","change"],index=range(0,9)) df = pd.DataFrame([a,b])
这将创建一个类似这样的水平表格:
| 0 | 1 | 2 | 3 | 4 | 5 | 6 | 7 | 8 | |
|---|---|---|---|---|---|---|---|---|---|
| 0 | 1 | 2 | 3 | 4 | 5 | 6 | 7 | 8 | 9 |
| 1 | I | like | to | use | Python | and | Pandas | very | much |
我们也可以使用 Series 作为列,并通过字典指定列名:
df = pd.DataFrame({ 'A' : a, 'B' : b })
这将给我们一个类似这样的表格:
| A | B | |
|---|---|---|
| 0 | 1 | I |
| 1 | 2 | like |
| 2 | 3 | to |
| 3 | 4 | use |
| 4 | 5 | Python |
| 5 | 6 | and |
| 6 | 7 | Pandas |
| 7 | 8 | very |
| 8 | 9 | much |
注意,我们也可以通过转置之前的表格来获得这个表格布局,例如通过写
df = pd.DataFrame([a,b]).T..rename(columns={ 0 : 'A', 1 : 'B' })
这里 .T means the operation of transposing the DataFrame, i.e. changing rows and columns, and rename operation allows us to rename columns to match the previous example.
Here are a few most important operations we can perform on DataFrames:
Column selection. We can select individual columns by writing df['A'] - this operation returns a Series. We can also select a subset of columns into another DataFrame by writing df[['B','A']] - this return another DataFrame.
Filtering only certain rows by criteria. For example, to leave only rows with column A greater than 5, we can write df[df['A']>5].
Note: The way filtering works is the following. The expression
df['A']<5returns a boolean series, which indicates whether expression isTrueorFalsefor each element of the original seriesdf['A']. When boolean series is used as an index, it returns subset of rows in the DataFrame. Thus it is not possible to use arbitrary Python boolean expression, for example, writingdf[df['A']>5 and df['A']<7]would be wrong. Instead, you should use special&operation on boolean series, writingdf[(df['A']>5) & (df['A']<7)](括号很重要)。
创建新的可计算列。我们可以通过使用直观的表达式轻松地为我们的数据框创建新的可计算列,例如:
df['DivA'] = df['A']-df['A'].mean()
此示例计算 A 列与平均值的偏差。实际上发生的是我们计算了一个系列,然后将其赋值给左侧,从而创建了另一个列。因此,我们不能使用任何与系列不兼容的操作,例如,下面的代码是错误的:
# Wrong code -> df['ADescr'] = "Low" if df['A'] < 5 else "Hi" df['LenB'] = len(df['B']) # <- Wrong result
后一个示例虽然在语法上正确,但给出了错误的结果,因为它将 B to all values in the column, and not the length of individual elements as we intended.
If we need to compute complex expressions like this, we can use apply 函数的长度分配给了 B。最后一种情况可以写成如下:
df['LenB'] = df['B'].apply(lambda x : len(x)) # or df['LenB'] = df['B'].apply(len)
经过上述操作后,我们最终会得到以下数据框:
| A | B | DivA | LenB | |
|---|---|---|---|---|
| 0 | 1 | I | -4.0 | 1 |
| 1 | 2 | like | -3.0 | 4 |
| 2 | 3 | to | -2.0 | 2 |
| 3 | 4 | use | -1.0 | 3 |
| 4 | 5 | Python | 0.0 | 6 |
| 5 | 6 | and | 1.0 | 3 |
| 6 | 7 | Pandas | 2.0 | 6 |
| 7 | 8 | very | 3.0 | 4 |
| 8 | 9 | much | 4.0 | 4 |
基于数字选择行 可以使用 iloc 构造完成。例如,要从数据框中选择前五行:
df.iloc[:5]
分组 经常用于获取类似 Excel 中的“透视表”结果。假设我们想计算 A for each given number of LenB. Then we can group our DataFrame by LenB, and call mean:
df.groupby(by='LenB').mean()
如果我们需要计算组中的均值和元素数量,则可以使用更复杂的 aggregate 函数:
df.groupby(by='LenB') \ .aggregate({ 'DivA' : len, 'A' : lambda x: x.mean() }) \ .rename(columns={ 'DivA' : 'Count', 'A' : 'Mean'})
这将给出以下表格:
| LenB | Count | Mean |
|---|---|---|
| 1 | 1 | 1.000000 |
| 2 | 1 | 3.000000 |
| 3 | 2 | 5.000000 |
| 4 | 3 | 6.333333 |
| 6 | 2 | 6.000000 |
获取数据
我们已经看到如何从 Python 对象构造 Series 和 DataFrames。然而,数据通常以文本文件或 Excel 表的形式出现。幸运的是,Pandas 提供了一种简单的方法从磁盘加载数据。例如,读取 CSV 文件就像这样简单:
df = pd.read_csv('file.csv')
在“挑战”部分,我们将看到更多加载数据的示例,包括从外部网站获取数据。
打印和绘图
数据科学家经常需要探索数据,因此能够可视化数据非常重要。当数据框很大时,我们很多时候只是想通过打印出前几行来确保一切正确。这可以通过调用 `df.head()``. If you are running it from Jupyter Notebook, it will print out the DataFrame in a nice tabular form.
We have also seen the usage of plot function to visualize some columns. While plot is very useful for many tasks, and supports many different graph types via kind= parameter, you can always use raw matplotlib library to plot something more complex. We will cover data visualization in detail in separate course lessons.
This overview covers most important concepts of Pandas, however, the library is very rich, and there is no limit to what you can do with it! Let's now apply this knowledge for solving specific problem.
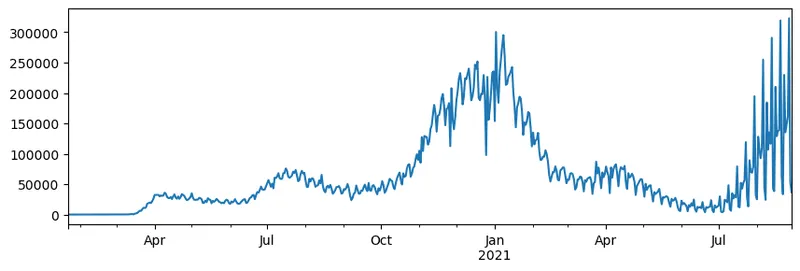
Challenge 1: Analyzing COVID Spread
First problem we will focus on is modelling of epidemic spread of COVID-19. In order to do that, we will use the data on the number of infected individuals in different countries, provided by the Center for Systems Science and Engineering (CSSE) at Johns Hopkins University. Dataset is available in this GitHub Repository.
Since we want to demonstrate how to deal with data, we invite you to open notebook-covidspread.ipynb and read it from top to bottom. You can also execute cells, and do some challenges that we have left for you at the end.
If you do not know how to run code in Jupyter Notebook, have a look at this article.
Working with Unstructured Data
While data very often comes in tabular form, in some cases we need to deal with less structured data, for example, text or images. In this case, to apply data processing techniques we have seen above, we need to somehow extract structured data. Here are a few examples:
- Extracting keywords from text, and seeing how often those keywords appear
- Using neural networks to extract information about objects on the picture
- Getting information on emotions of people on video camera feed
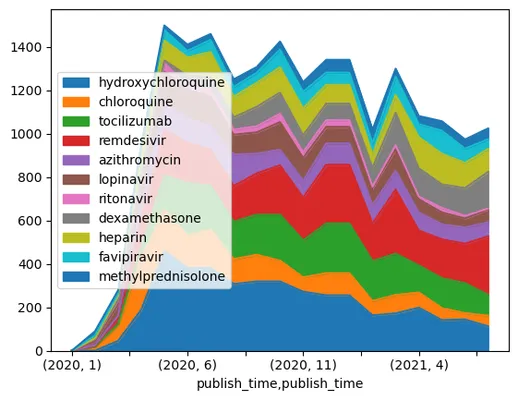
Challenge 2: Analyzing COVID Papers
In this challenge, we will continue with the topic of COVID pandemic, and focus on processing scientific papers on the subject. There is CORD-19 Dataset with more than 7000 (at the time of writing) papers on COVID, available with metadata and abstracts (and for about half of them there is also full text provided).
A full example of analyzing this dataset using Text Analytics for Health cognitive service is described in this blog post. We will discuss simplified version of this analysis.
NOTE: We do not provide a copy of the dataset as part of this repository. You may first need to download the
metadata.csvfile from this dataset on Kaggle. Registration with Kaggle may be required. You may also download the dataset without registration from here, but it will include all full texts in addition to metadata file.
Open notebook-papers.ipynb 并从头到尾阅读。你也可以执行单元格,并完成我们在结尾留下的挑战。
处理图像数据
最近,开发出了非常强大的 AI 模型,使我们能够理解图像。有许多任务可以通过预训练神经网络或云服务解决。一些例子包括:
- 图像分类,可以帮助你将图像归类到预定义的类别之一。你可以轻松地使用诸如 Custom Vision 等服务训练你自己的图像分类器。
- 对象检测,用于检测图像中的不同对象。诸如 计算机视觉 之类的云服务可以检测许多常见对象,你可以训练 Custom Vision 模型来检测特定的兴趣对象。
- 面部检测,包括年龄、性别和情绪检测。这可以通过 Face API 实现。
所有这些云服务都可以使用 Python SDKs 调用,因此可以轻松地集成到你的数据探索工作流程中。
这里有一些从图像数据源探索数据的例子:
- 在博客文章 如何无需编码学习数据科学 中,我们探索了 Instagram 照片,试图了解什么使得照片获得更多点赞。我们首先使用 计算机视觉 从图片中提取尽可能多的信息,然后使用 Azure 机器学习 AutoML 构建可解释的模型。
- 在 面部研究研讨会 中,我们使用 Face API 从活动的照片中提取人脸的情绪,以尝试了解什么让人感到快乐。
结论
无论你已经有结构化还是非结构化的数据,使用 Python 都可以完成与数据处理和理解相关的所有步骤。这可能是最灵活的数据处理方式,这也是为什么大多数数据科学家都选择 Python 作为他们的主要工具的原因。如果你认真对待数据科学之旅,深入学习 Python 可能是个好主意!
课后测验
复习与自学
书籍
在线资源
学习Python
- 使用海龟图形和分形以有趣的方式学习Python
- 在Microsoft Learn上迈出Python学习的第一步 Microsoft Learn上的学习路径
作业
致谢
本课程由Dmitry Soshnikov精心编写,并附有爱心
声明:
本文件灏天文库团队进行了翻译。尽管我们力求准确,但请注意,翻译可能包含错误或不准确之处。原文档以其原始语言为准。我们不对因使用此翻译而产生的任何误解或误译负责。